A closed set
Evidence · Scarcity
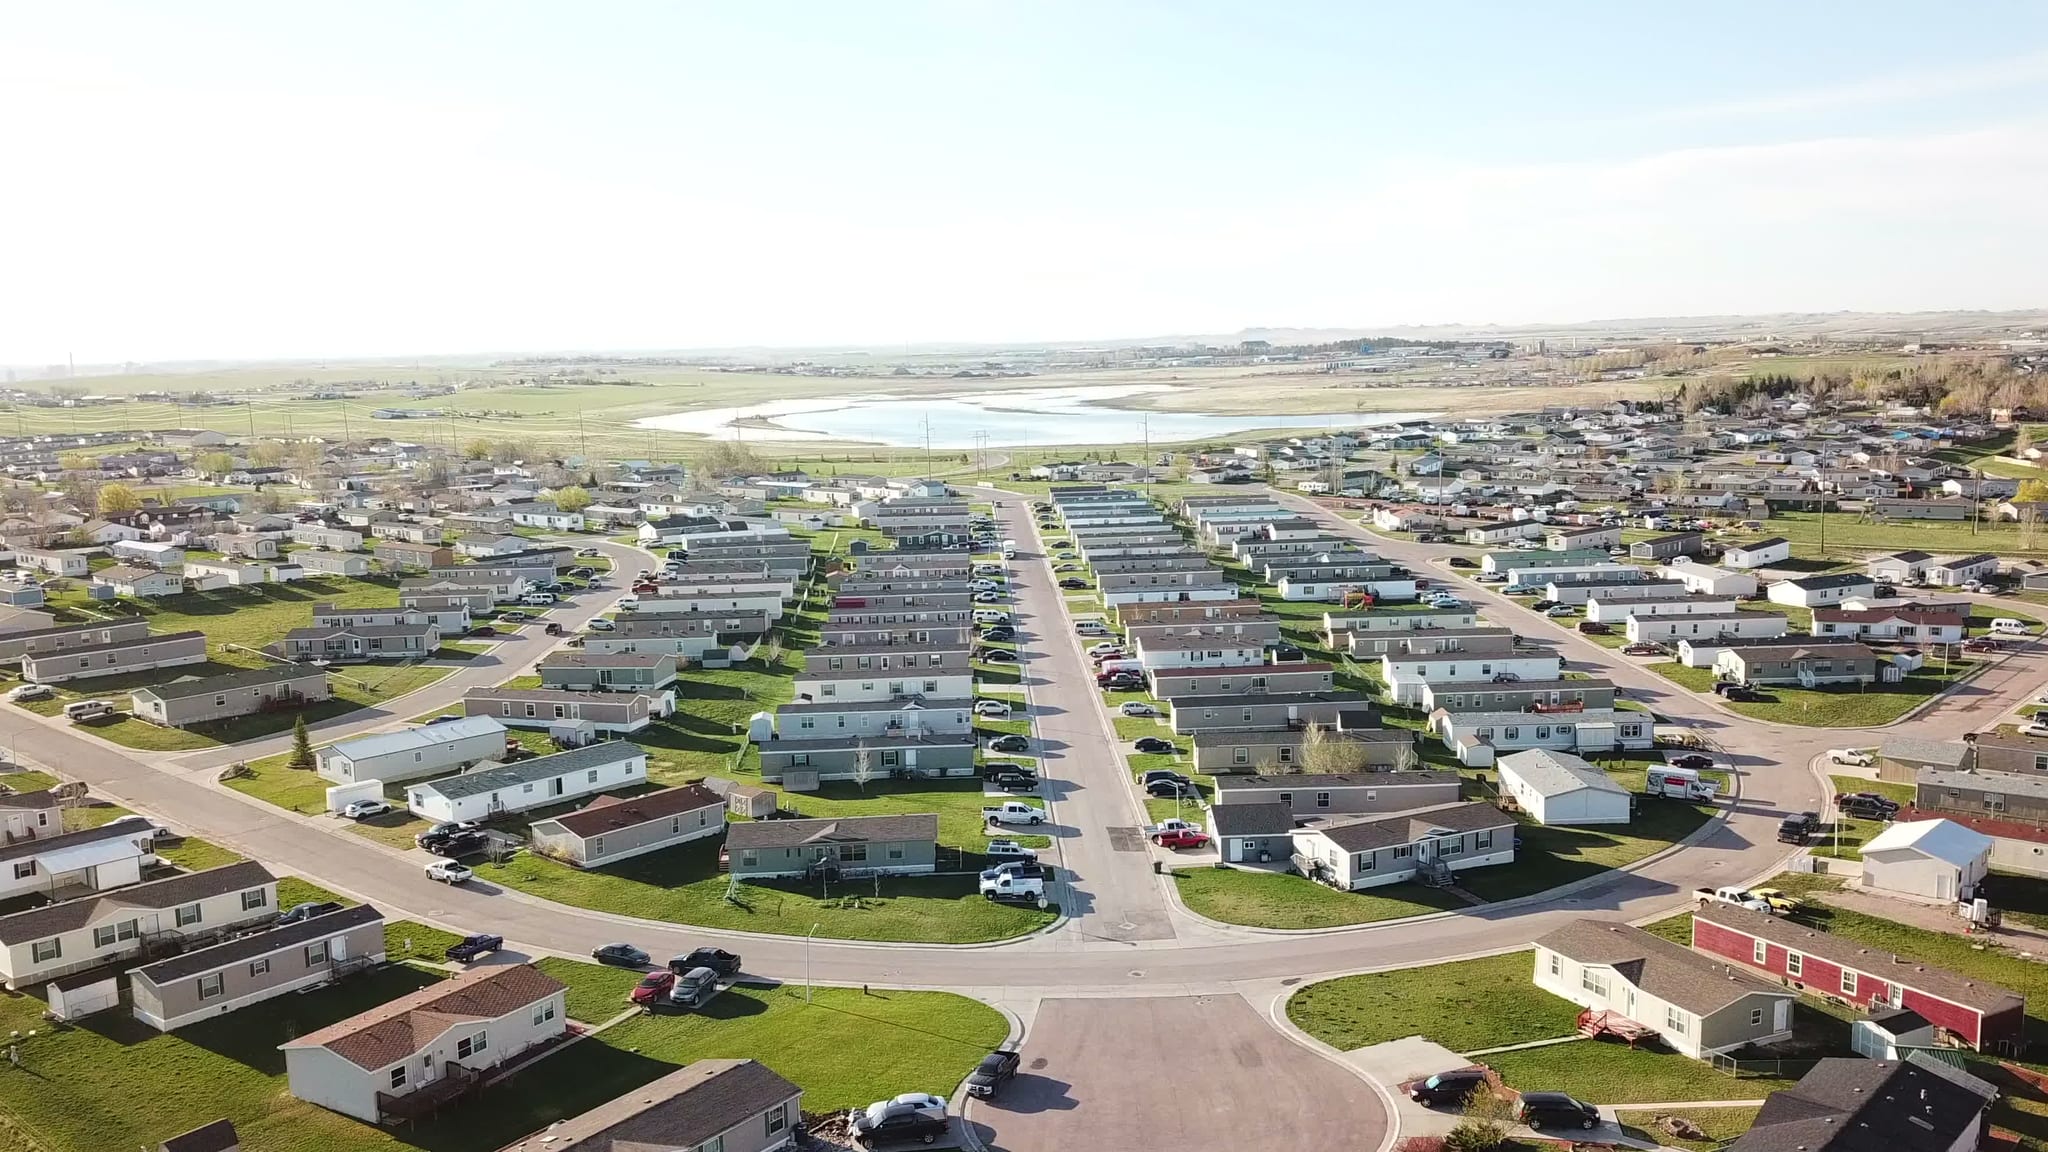
About 16.5 million Americans — one household in twenty — live in a manufactured home. The communities they live in are effectively a closed set: zoning decides where one can exist, and it almost never says yes.
This is the supply file behind the land thesis: a stock that stands still while the rest of American housing grows, and a market that prices what already exists accordingly.
The stock that stands still
The scarcity argument needs no unit-loss arithmetic and no error bars. 43,000 communities. 4.3 million homesites. That is the supply. While the total U.S. housing stock added roughly three million units over two years, the manufactured stock held flat to slightly lower — and the market has been repricing what already exists accordingly.
Figure 1.1 · The fixed denominator
The supply curve is a flat line
Indexed to 2022, total U.S. housing units grew 2.07% by 2024. Manufactured housing units did not grow at all. Every community operating today competes with a supply that is fixed — which is precisely what the owner of an existing community wants.
U.S. housing units, indexed to 2022 = 100
Manufactured housing units vs. total housing units, 2022–2024
Data table
Show the work — sources & the margin of error
The margin of error, stated before anyone asks: the implied two-year decline in manufactured units is roughly 115,800 with a margin of error of about ±81,800 — significant at 90% confidence, but thin. Treat it as direction, not a precise count. “The stock held flat while total housing grew by three million” is safe; a precise-looking unit count is not. Zoning scarcity is the argument; the Census series is only its illustration.
Why nothing gets built
Federal policy leaves the gate where it is: P.L. 119-101 sec. 107(e) keeps HUD's zoning guidance advisory, so the local approval math that stopped new communities being built is unchanged — the full policy record is in the policy catalyst.
What the market pays for what cannot be rebuilt
Figure 1.2 · What the market pays for scarcity
First of twelve sectors, on one provider’s index
Comparing sectors across different sources is not a comparison. Green Street prices twelve property sectors on a single methodology — and manufactured home parks carry the highest index level of any of them, having recovered to within 8% of their 2022 peak while the all-property index remains 14% below.
Green Street Commercial Property Price Index by sector · index level, June 2026
Higher = greater cumulative value growth since the index base. Distance from each sector’s 2022 peak at right.
Data table
Show the work — sources & the superlative rule
The superlative rule: highest index level is the defensible claim. Nearest to its 2022 peak is not — mall (−1%), strip retail (−2%) and student housing (−4%) all sit closer than manufactured home parks (−8%). The drawdown column travels with the level column so the flattering half never ships alone.
Permission: Green Street’s licence is internal-use by default; redistribution rights must be confirmed before external publication — unlike Nareit, this one is not routinely granted.
Sources
- Green Street Commercial Property Price Index, 4 June 2026 release. https://info.greenstreet.com/hubfs/GSCPPI-20260604press.pdf
- Manufactured Housing Institute — “Manufactured Home Communities in the U.S.” https://www.manufacturedhousing.org/industry-resources/community-research/manufactured-housing-communities-in-the-u-s/
- U.S. Census Bureau — American Community Survey 1-Year Estimates, Table B25024 (2022–2024); Manufactured Housing Survey 2024.
- H.R. 6644, 21st Century ROAD to Housing Act — action record and roll calls. https://www.congress.gov/bill/119th-congress/house-bill/6644