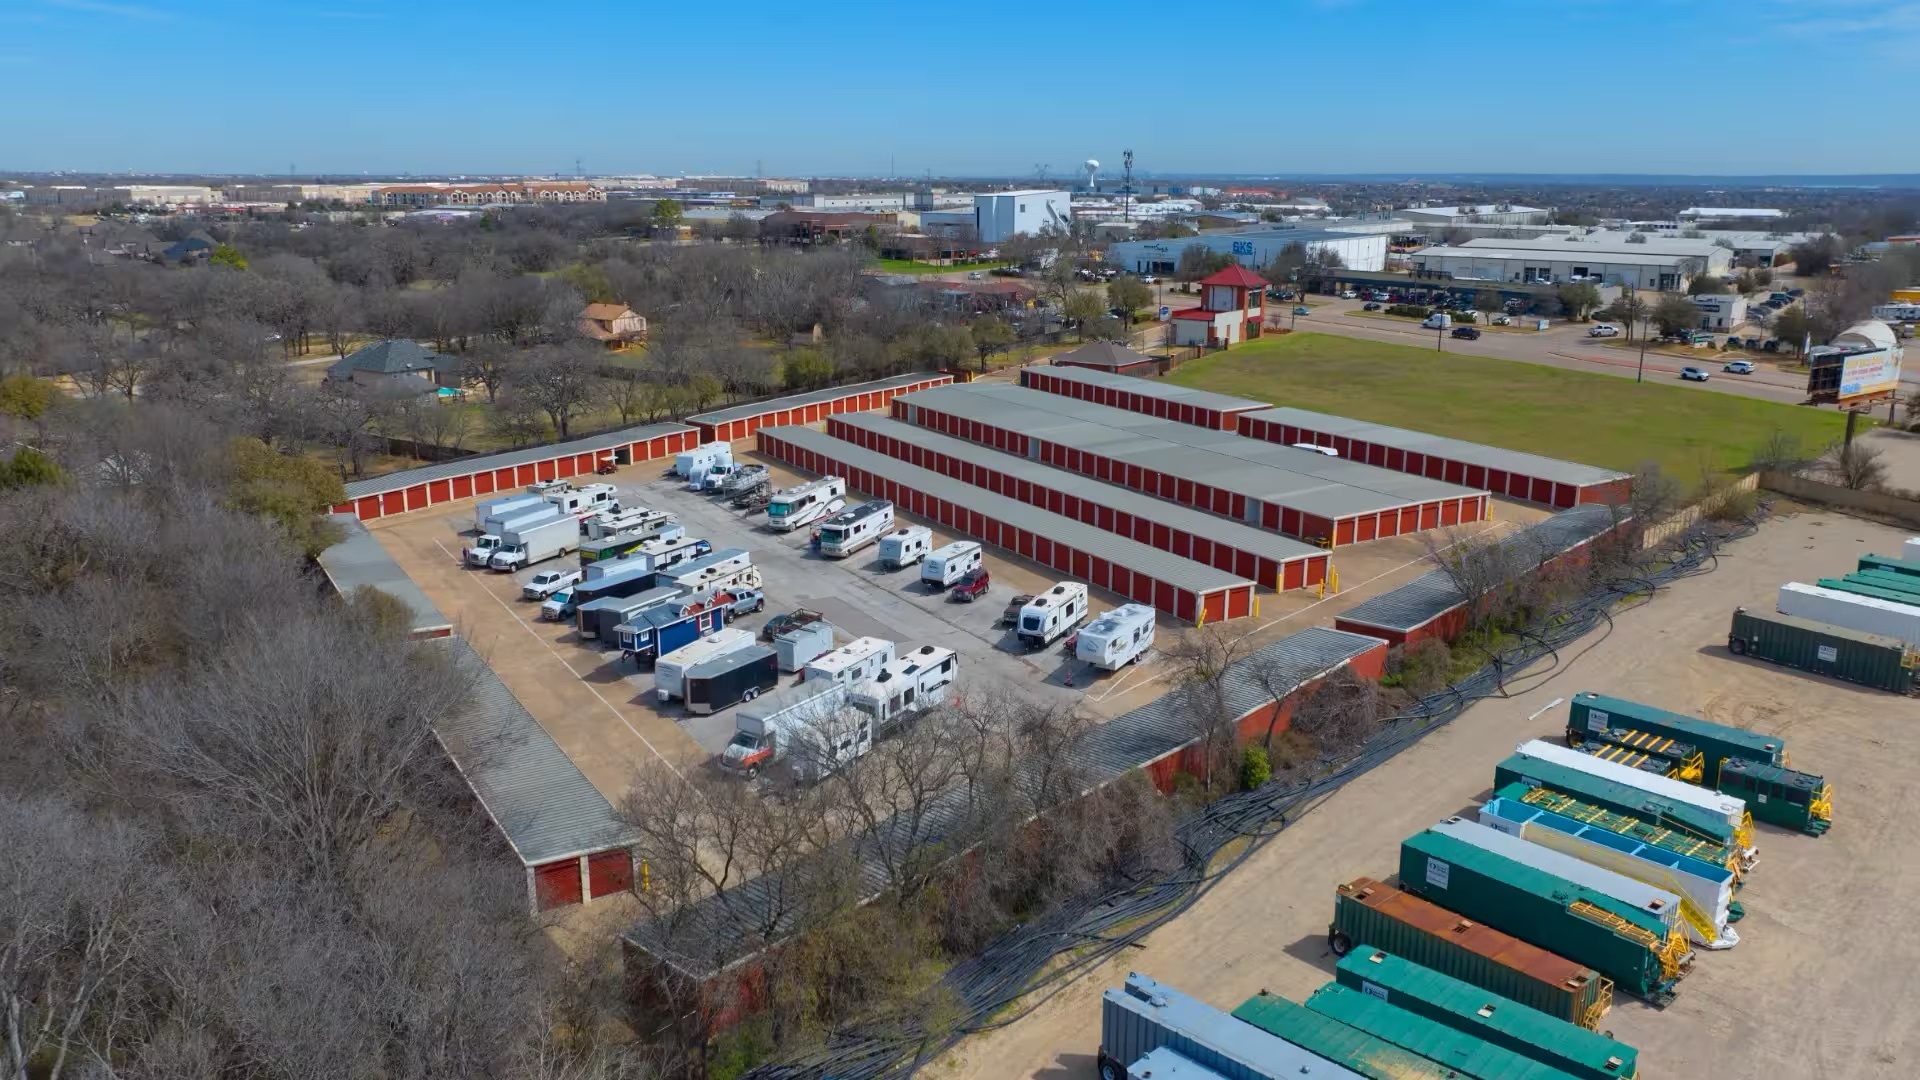
The other side of the surge
Self-storage had a spectacular pandemic. Occupancy hit record highs, rents climbed to all-time peaks, and capital poured into new development. Then the cycle turned. The interesting question for 2026 is not whether the surge ended — it did — but what the sector looks like on the other side of it.
The correction, in numbers
Round 1 of 3: At the trough, how far had sector values fallen from their post-pandemic peak?
Three figures, all stated in the prose below. Drag, commit, and see how calibrated you are. No stakes. Almost no stakes.
Sector values fell roughly 25% from their post-pandemic peak before pricing found a floor around mid-2025 and began to recover — that is the trough, as carried through trade coverage of Green Street data in the first half of 2026.4 Where the sector stands now is a separate number with a date on it: Green Street's own 4 June 2026 release puts self storage 22% below its 2022 peak, still the second-highest index level of the twelve property sectors it prices.1 National advertised street rates were still modestly negative year over year in early 2026 — around $131 per month in March, down about 2.2% from a year earlier — though the pace of decline has been losing momentum.2 Occupancy has been bifurcated: large public operators reported same-store occupancy in the mid-80s to low-90s, while many private and smaller-operator assets sat lower.4
Show the work — sources
Green Street data as cited in industry reporting (HB Capital / CRE Daily, Q1–Q2 2026): self-storage values roughly 25% off peak at the trough, supply growth at an 11-year low, starts down about 21% from 2023. https://www.greenstreet.com/insights
Yardi Matrix, National Self Storage Report (early 2026): national street rates (~$131/mo, ~-2.2% YoY, March 2026) and length-of-stay trends. https://www.yardimatrix.com/publications
Figures attributed to third parties are as of the dates shown and were not independently verified by Freedom Funds.
Figure 1.1 · Storage, ranked against everything else
Second of twelve on value. Second-deepest hole to climb out of.
Comparing sectors across different sources is not a comparison. Green Street prices twelve property sectors on a single methodology — and self storage carries the second-highest index level of any of them, which is the surge, still sitting in the number. It also sits 22% below its own 2022 peak, the second-deepest drawdown of the twelve behind only office. Both halves are this article: a sector that compounded hard, then repriced hard, and is now being bought on the second fact rather than the first.
Green Street Commercial Property Price Index by sector · index level, June 2026
Higher = greater cumulative value growth since the index base. Distance from each sector's 2022 peak at right. The index is property value: it carries no income component, so it is not a return.
Data table
Show the work — sources, the two dates & the superlative rule
Two dates, not two answers: trade coverage in the first half of 2026 put storage values roughly 25% off peak; Green Street's own 4 June 2026 release puts the sector 22% below its 2022 peak. Those are readings taken at different moments in a market this article describes as recovering off a mid-2025 floor — not competing estimates of the same moment. Each is printed with its date, and neither is restated as the other. Where only the dated release will do, the release is what this page cites.
Value, not return: the CPPI is a price index with no income component. "Index level" and "value" are the right words for it; "return" and "total return" are not, in any caption, tooltip or summary.
The superlative rule: second-highest index level and second-deepest drawdown are both exact counts off the same table, and they travel together. Hardest hit is not defensible — office (−34%) sits far deeper. Nor is best recovered: mall (−1%), strip retail (−2%) and student housing (−4%) are all nearer their peaks. The level column and the drawdown column ship side by side so the flattering half never ships alone.
Permission: Green Street's licence is internal-use by default; redistribution rights must be confirmed before external publication.
Demand cooled, but for a revealing reason
The demand softness traces largely to a frozen housing market. With mortgage rates elevated, existing-home sales have run well below their historical pace and interstate migration has reset sharply from its 2021–2022 highs, which cooled the moves that generate storage demand.3 Yet the same lock-in effect cuts the other way: customers are staying longer, with average length of stay rising to roughly 18–19 months.2 Fewer move-ins, but also fewer move-outs, has kept occupancy more stable than the rate headlines suggest.
Show the work — sources
Yardi Matrix, National Self Storage Report (early 2026): national street rates (~$131/mo, ~-2.2% YoY, March 2026) and length-of-stay trends. https://www.yardimatrix.com/publications
Figures attributed to third parties are as of the dates shown and were not independently verified by Freedom Funds.
Supply is finally the tailwind
New supply is the single most important variable in storage underwriting, and for the first time in years it is working in owners' favor. Industry data put new supply growth at an eleven-year low in 2025, with construction starts down about 21% from their 2023 peak as elevated construction costs and tighter lending made new projects harder to justify.4 When less competing supply is coming, existing well-located facilities are the beneficiaries.
Show the work — sources
Figures attributed to third parties are as of the dates shown and were not independently verified by Freedom Funds.
Where the yield is
The opportunity we see is not a bet on a rate cut or a rent spike. It is basis. Buying stabilized cash flow below replacement cost, in submarkets where the forward pipeline is thin, lets an operator earn a current yield today and benefit from constrained supply tomorrow — without needing heroic assumptions. We are selective about geography: some Sun Belt markets that absorbed the most construction are still working through it, while supply-constrained locations have held pricing power.2
None of this is a forecast. Rents could stay soft longer than expected, local markets can be oversupplied, and storage is intensely local. But a sector that has already repriced, with new supply at a decade-plus low and demand that is need-based rather than discretionary, is exactly the kind of setup disciplined operators prefer. Targets and views here are illustrative, not guaranteed, and current as of publication.
Sources
- Green Street Commercial Property Price Index, 4 June 2026 release — index level and distance from the 2022 peak by sector (twelve property sectors plus the all-property benchmark). https://info.greenstreet.com/hubfs/GSCPPI-20260604press.pdf
- Yardi Matrix, National Self Storage Report (early 2026): national street rates (~$131/mo, ~-2.2% YoY, March 2026) and length-of-stay trends. https://www.yardimatrix.com/publications
- PwC & Urban Land Institute, "Emerging Trends in Real Estate 2026," and U.S. Census Bureau data on existing-home sales and migration. https://www.pwc.com/us/en/industries/financial-services/asset-wealth-management/real-estate/emerging-trends-in-real-estate.html
- Green Street data as cited in industry reporting (HB Capital / CRE Daily, Q1–Q2 2026): self-storage values roughly 25% off peak at the trough, supply growth at an 11-year low, starts down about 21% from 2023. https://www.greenstreet.com/insights